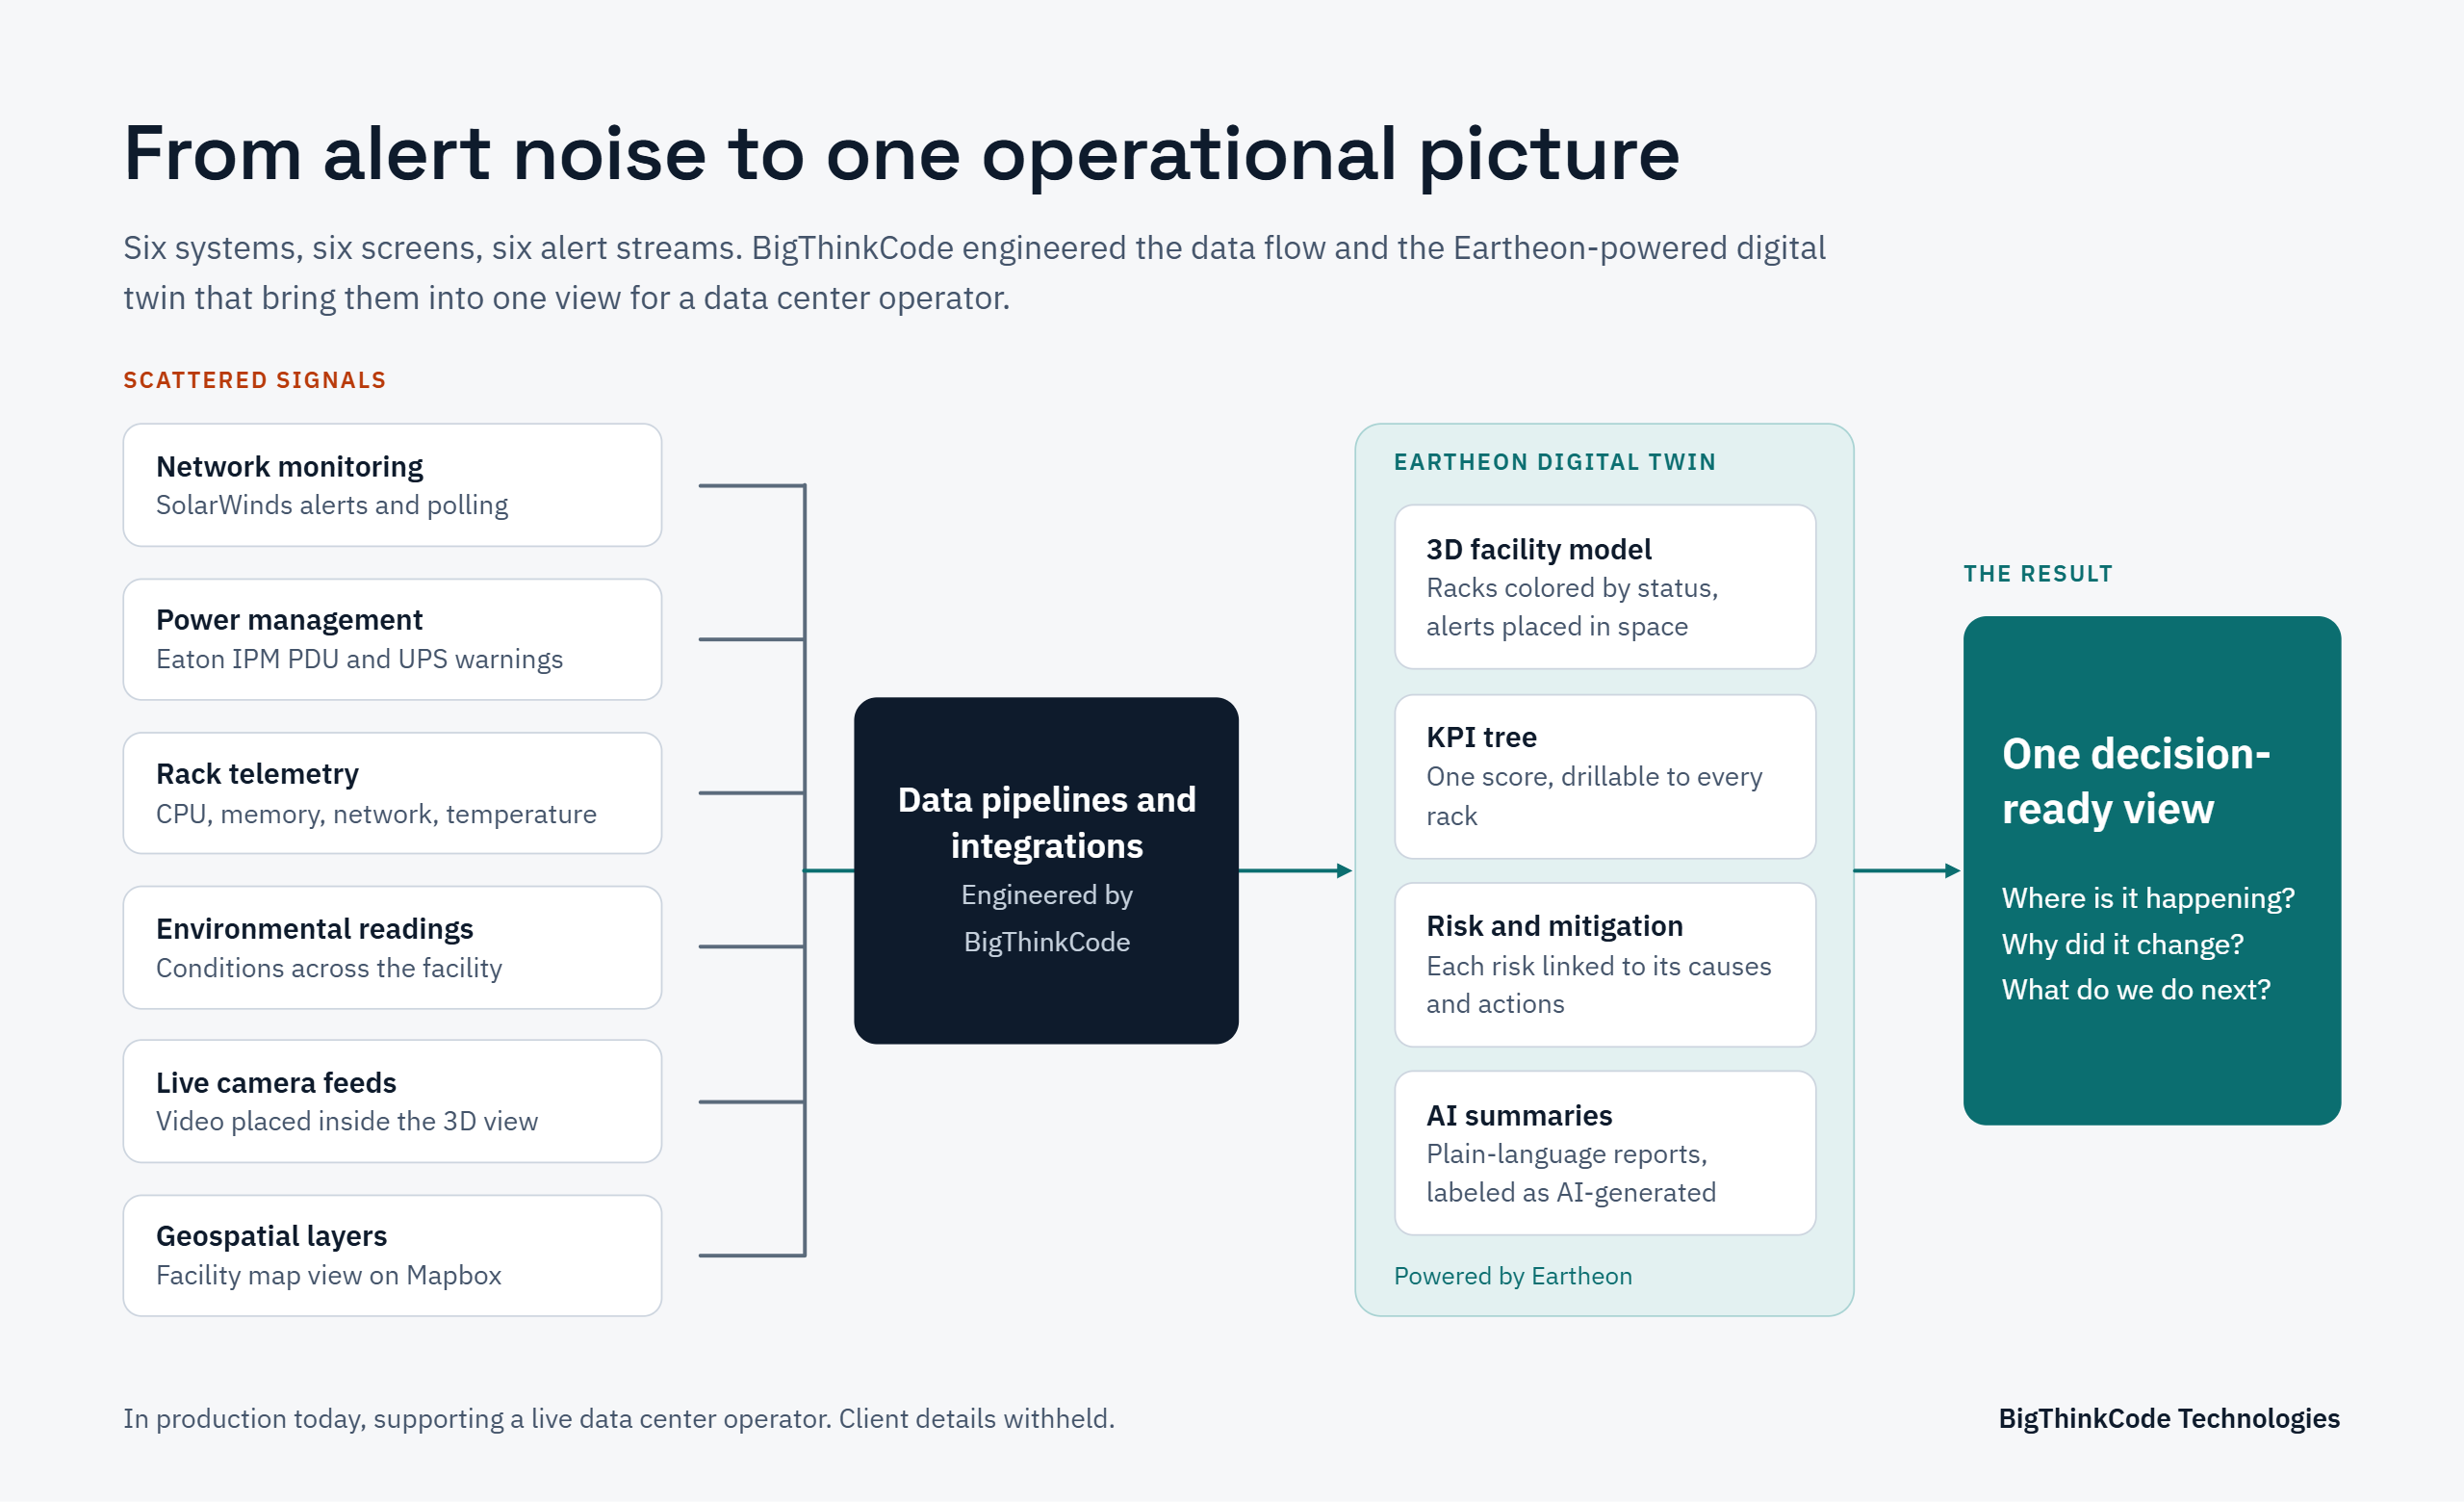
A data center operations team rarely lacks data. Power systems, network monitoring, cooling controls, and cameras each produce their own alerts, in their own tools, on their own screens. The hard part is knowing which signal matters, where it is happening, and what to do next.
We took on that problem for a data center operator, with a digital twin platform powered by Eartheon. BigThinkCode engineered the full build: the front end, the 3D environment, the data pipelines, the integrations and the AI layer. The platform is in production today, supporting a live facility. This article explains the decisions behind it, because they apply well beyond data centers.
A failed power module, a saturated network interface and a hot rack can each look minor on a separate screen. Together they can mean a facility is close to an incident. There is a quieter problem too: a device that has stopped reporting can look the same on a dashboard as a device that is healthy.
The operator needed one operational view that would not replace its existing monitoring tools. It had to sit on top of them, make sense of them, and let engineers trace any number back to its source.
Data layer: pipelines and integrations bring in alerts, polling status and telemetry from network monitoring, power management, rack telemetry, environmental sensors and camera feeds.
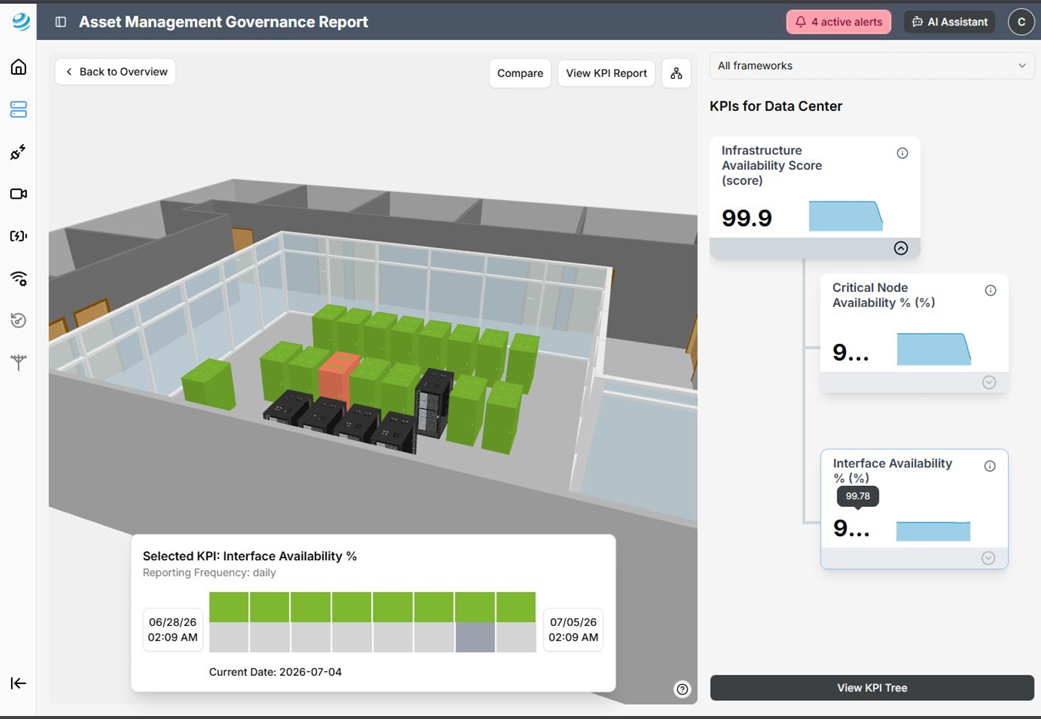
Metric layer: KPIs organized in a tree, reported daily and evaluated against fixed thresholds, rolled up into a facility-level resilience index and a central failure-risk score.
Risk layer: each risk linked to its contributing KPIs, an impact level and mitigation notes.
Spatial layer: an interactive 3D facility model with rack-level drill-down, status coloring, period comparison and embedded camera feeds.
Alert workflow: filtering by domain, time range, severity and status, with links back to the source system and the asset owner.
AI layer: executive summaries and KPI reports from a third-party model that BigThinkCode trained, labeled as AI-generated.
Takeaway: the platform is built in layers, so each part can be trusted, traced and improved on its own.
The people who approve, run and fix a data center need different answers from the same data. The platform is organized as a drill-down, from the whole facility to the individual node, so each role starts at its own altitude and can go deeper without switching tools.
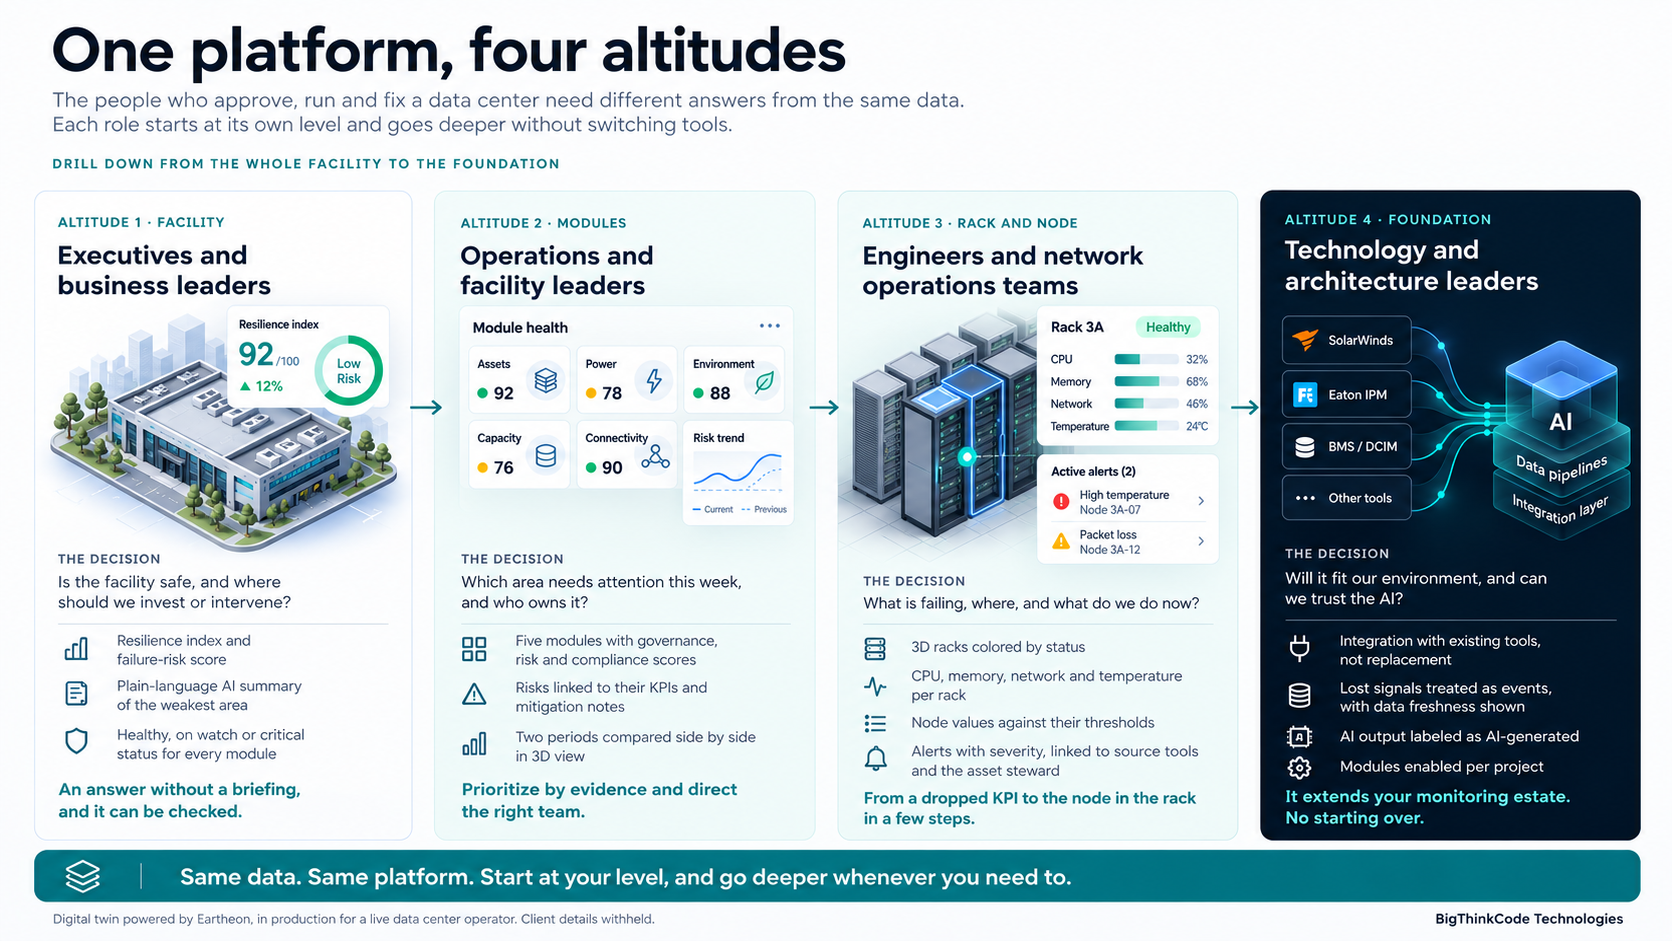
The decision: is the facility safe, and where should we invest or intervene?
The platform opens a data center resilience index and a central failure-risk score, where lower risk is better. Beside them sits an executive AI summary in plain language. It names the area of greatest concern and what is driving it, so a leader gets the picture in about a minute. A module health grid shows which areas are healthy, on watch or critical, and each score opens into its own detail, so “why” is always one click away.
Takeaway: leaders get an answer without a briefing, and the answer can be checked.
The decision: which area needs attention this week, and who owns it?
The module health grid covers asset management, power management, environmental monitoring, capacity planning and connectivity. Each module carries governance, risk and compliance scores, a health status and an open-alert count. The risk dashboard links each risk to its contributing KPIs and mitigation notes. A side-by-side comparison of two periods in the 3D view shows whether things are improving or getting worse.
Takeaway: operations leaders can prioritize by evidence and direct the right team to the right problem.
The decision: what is failing, where, and what do we do now?
Racks appear in a 3D model colored by status. Selecting one opens its CPU, memory, network throughput and temperature, over a time window you choose. Within the risk and KPI views, individual nodes show their values against their thresholds. The alert list carries severity and status, links straight into the originating tool such as SolarWinds or Eaton IPM and offers a route to the asset steward. Live camera feeds sit inside the 3D scene for physical context.
Takeaway: From “a KPI dropped” to “this node in this rack” takes a few steps.
The decision: will it fit our environment, and can we trust the AI?
The platform integrates with the tools teams already run instead of replacing them. Its pipelines treat a lost signal as an event and show how fresh each number is, and the AI output is labeled as AI-generated. Modules can be enabled per project. The technical deep dive below explains each design choice.
Takeaway: the platform extends your existing monitoring estate, so adopting it does not mean starting over.
The same thinking powers our TiNAI digital twin for land use planning, also powered by Eartheon. The domain is different: states, sectors, and land systems instead of racks and power. The pattern is the same:
- Unify scattered data into one trusted view.
- Turn it into KPIs that mean something to decision-makers
- Add an AI layer that makes complex data accessible to non-specialists.
That repeatability is what we think matters most. We bring a method to digital twin work and apply it wherever data is scattered, and decisions are high stakes.
If your teams juggle monitoring systems and still lack one clear operational picture, whether in infrastructure, energy, manufacturing, logistics, or public-sector planning, we’d love to talk it through. Talk to our engineering team.